
The true cost of unaffordable housing
Housing affordability is one of the key elements of the right to a decent home. The Human Rights Commission is publishing a set of indicators called Measuring Progress.
December 15, 2021
Housing affordability is one of the key elements of the right to a decent home. The Human Rights Commission is publishing a set of indicators called Measuring Progress.
These indicators show that housing affordability has declined since the 1980s. Fewer New Zealanders can afford to buy their own home and more people face the burden of high housing costs. This means that housing affordability has not met the human rights requirements called “progressive realisation".
When we talk about human rights, making things better over time is called “progressive realisation”. Progressive realisation means things should get better over time – not just generally, but for everyone.
Housing affordability has two components. The first component is the cost of adequate housing (eg. a deposit, mortgage payments, bond, and rent). The cost of housing can usually be described using a dollar value such as $550.00 per week. The second component is people’s ability to meet those costs. While $550.00 per week might not be a problem for some people, it is unaffordable for others. This means lower-income households are especially at risk from high housing costs.
Unaffordable housing means that people have little money left for necessities like food, healthcare, and other bills such as power. People who don’t have access to affordable housing may not be able to meet all their essential needs, and they might be forced to choose. To afford housing, people might have to live in housing that is poor quality. They might have to crowd into homes that are too small for the number of people living there or live somewhere that is bad for their health.
Home ownership is one of the main sources of wealth in Aotearoa. It also offers security and a sense of place. People who own their own home tend to find housing costs more affordable, but in recent years it has become increasingly difficult for people to become homeowners. This is particularly true for Māori, Pacific peoples, and younger people.
Census data shows that Māori had higher rates of homeownership than the total population in the 1930s, but this rate began to fall from the 1940s. Rates of homeownership peaked in the 1990s, but then fell for all groups, before levelling out between 2013 and 2018. The rate for Māori was relatively unchanged between 2013 and 2018. Since the 2018 Census, house prices have risen sharply. This may have impacted further on people’s ability to buy their first home. The next official homeownership rates will be available from the 2023 Census.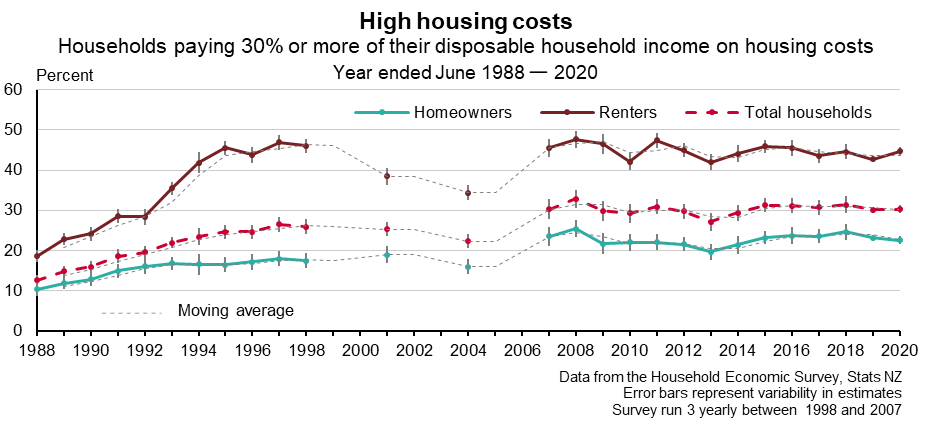

It is getting harder to become a homeowner
House prices have increased faster than wages have grown since 2013. The regions that are particularly affected are Auckland and Wellington, though others have experienced it too.

Burden of high housing costs has risen since the 1980s
Home ownership rates have declined from the 1990s while renting has also become less affordable. This means that renters not only miss out on the financial and social benefits of home ownership, they are also paying more in rent than they used to.
How do we know whether housing is “affordable”? One way is to compare how much income a household has, with how much of that income it spends on housing. If a household spends more than 30% of its income on housing costs, this may mean that the housing isn’t affordable for the people living there. If we assess affordability like this, then we can see that housing is consistently less affordable for renters than people who own their own home. Just under half (45%) of renters spent 30% or more of their income (after tax) on housing in the year ended June 2020. By comparison, just 23% of homeowners spent a similar proportion. We can also see that housing affordability has gotten worse for everybody since 1988.
If we compare housing costs in 1988 and 2020, only 13% of households had high housing costs in 1988, but 30% of households had high housing costs in 2020.

Housing affordability got worse in the 1990s, before flattening out in the early 2000s. It then got worse again around the time of the Global Financial Crisis in 2008. Since 2008, affordability has stayed about the same. This lack of improvement is important because it shows that New Zealand is not meeting its obligations to improve housing affordability over time. Not only are housing costs in New Zealand often unaffordable, but they are also unequally unaffordable. Progressive realisation requires this inequality to improve over time.
Who finds housing unaffordable?
Data from the 2018 General Social Survey shows that one parent families, recent migrants, Māori, Pacific peoples, low-income earners, non-owner-occupiers, Aucklanders, the unemployed, disabled people, and those with no qualifications are among the most likely to rate their housing unaffordable. People from these groups frequently rated the affordability of their housing as 3 or lower on a scale of 0 to 10, where 0 was very unaffordable and 10 was very affordable.

What does it mean to have unaffordable housing?
People living in unaffordable housing were more likely to be in a situation where they had to choose between paying the costs of their housing or meeting other basic needs. This meant being more likely to put up with things like feeling cold, putting off visits to the doctor, or going without fresh fruit and vegetables, than people whose housing was more affordable.

Declining housing affordability affects all households. Housing expenditure is about a quarter of all household expenditure, followed by food and transport. Having less income after housing costs are met can sometimes prevent people from having other necessities. It can also be a barrier to improving their housing situation, particularly for renters who have less money left over to save for a home of their own.
Overall, the affordability indicators show that there has not been progressive realisation in this dimension of the right to a decent home. In fact, things have got worse since the 1980s. Housing is less affordable than it used to be. Measuring Progress therefore shows a failure in the affordability dimension of the right to a decent home.
References
MSD (2016). The Social Report. Retrieved from www.msd.govt.nz
Perry B (2019). Household incomes in New Zealand: Trends in indicators of inequality and hardship 1982 to 2018. MSD. Retrieved from www.msd.govt.nz
Stats NZ (2021). Te Pā Harakeke: Māori housing and wellbeing 2021. Retrieved from www.stats.govt.nz
Stats NZ (2020). Housing in Aotearoa: 2020. Retrieved from www.stats.govt.nz.
Statistics New Zealand (2016). Changes in home-ownership patterns 1986–2013: Focus on Māori and Pacific people. Available from www.stats.govt.nz.